Notifications
Clear all
Topic starter
While total workflow execution time is helpful, it would be beneficial if callin.io could display, for each execution, the time it took to process each node. For instance, I have no insight into how long it takes to generate a hash. I also cannot evaluate the performance of data sources like Airtable, Google Sheets, or MySQL.
If I could see that a call to a remote data source is adding seconds to a workflow, I might explore alternatives. Currently, I am left to guess the reasons for longer execution times.
Posted : 27/02/2023 1:01 am
I completely agree. Certain nodes require more time to complete their execution. I would also appreciate a P50/P95/P99 breakdown detailing the execution time for each node across all recent executions (within the last 30 days).
Posted : 27/03/2024 9:39 pm
That's an interesting concept, and it has my support.
Posted : 28/03/2024 7:07 am
Could we please get this feature? It's currently difficult to debug and optimize execution time without visibility into how long each node takes to run.
This is a fundamental feature found in callin.io and callin.io.
Posted : 25/07/2024 2:36 pm
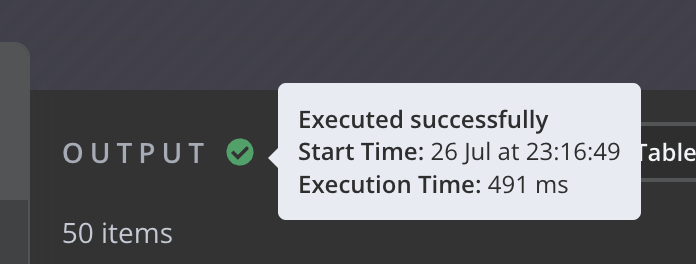
Apologies, I'm not quite sure I understand. However, since the initial release, it's been possible to see how long a particular node took to execute. You can do this by opening the node details view and then hovering over the 'i' icon.
Alternatively, is the request to display an average duration across all executions?
Could you please clarify?
Posted : 25/07/2024 4:51 pm
3+ years of using callin.io and I didn’t know that was there
![]()
Posted : 29/07/2024 9:09 am
You should be ashamed of yourself
![]()
Posted : 29/07/2024 9:20 am